19 ROC曲线
19.1 什么是ROC曲线?
ROC曲线反映敏感性和特异性连续变量的综合指标,用于二分类。
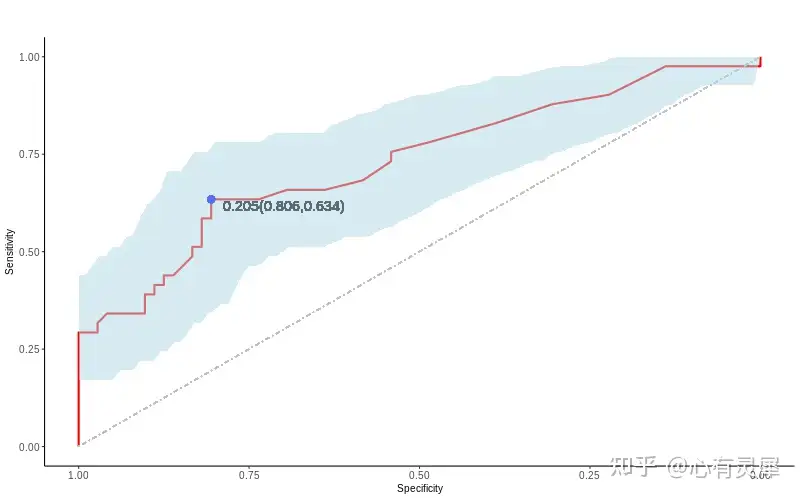
AUC:根据曲线位置,把整个图划分成了两部分,曲线下方部分的面积被称为 AUC(Area Under Curve),用来表示预测准确性,AUC 值越高,也就是曲线下方面积越大,说明预测准确率越高。曲线越接近左上角,预测准确率越高。
临界点cut off point:ROC曲线最靠近左上方那个点的临界值为最佳临界值。
本文我们就来讨论一下ROC曲线是如何绘制的以及如何对其进行解读。
19.2 绘图前的数据准备
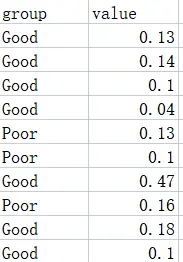
demo数据可以在https://www.bioladder.cn/shiny/zyp/bioladder2/demoData/ROC/demo.txt下载。
必须包含2列数据,必须有行名。第一列是分组,有且只能含有2个分组,第二列为对应的数值
19.3 R语言怎么画ROC曲线
# 加载R包,没有安装请先安装  install.packages("包名")
library(pROC)
library(ggplot2)

# 读取ROC数据文件
df = read.delim("https://www.bioladder.cn/shiny/zyp/bioladder2/demoData/ROC/demo.txt",# 这里读取了网络上的demo数据,将此处换成你自己电脑里的文件
                header = T    # 指定第一行是列名
)

# ROC计算
rocobj <- roc(df[,1], df[,2],
              # controls=df[,2][df[,1]=="Good"],  # 可以设置实验组或对照组
              # cases=df[,2][df[,1]=="Poor"],
              smooth = F       # 曲线是否光滑,当光滑时,无法计算置信区间
)
# 计算临界点/阈值
cutOffPoint <- coords(rocobj, "best")
cutOffPointText <- paste0(round(cutOffPoint[1],3),"(",round(cutOffPoint[2],3),",",round(cutOffPoint[3],3),")")

# 计算AUC值
auc<-auc(rocobj)[1]
# AUC的置信区间
auc_low<-ci(rocobj,of="auc")[1]
auc_high<-ci(rocobj,of="auc")[3]

# 计算置信区间
ciobj <- ci.se(rocobj,specificities=seq(0, 1, 0.01))
data_ci<-ciobj[1:101,1:3]
data_ci<-as.data.frame(data_ci)
x=as.numeric(rownames(data_ci))
data_ci<-data.frame(x,data_ci)

# 绘图
ggroc(rocobj,
      color="red",
      size=1,
      legacy.axes = F # FALSE时 横坐标为1-0 specificity;TRUE时 横坐标为0-1 1-specificity
      )+
  theme_classic()+
  geom_segment(aes(x = 1, y = 0, xend = 0, yend = 1),        # 绘制对角线
               colour='grey',
               linetype = 'dotdash'
  ) +
  geom_ribbon(data = data_ci,                                # 绘制置信区间
              aes(x=x,ymin=X2.5.,ymax=X97.5.),               # 当legacy.axes=TRUE时, 把x=x改为x=1-x
              fill = 'lightblue',
              alpha=0.5)+
  geom_point(aes(x = cutOffPoint[[2]],y = cutOffPoint[[3]]))+ # 绘制临界点/阈值
  geom_text(aes(x = cutOffPoint[[2]],y = cutOffPoint[[3]],label=cutOffPointText),vjust=-1) # 添加临界点/阈值文字标签
19.4 BioLadder生信云平台在线绘制ROC曲线
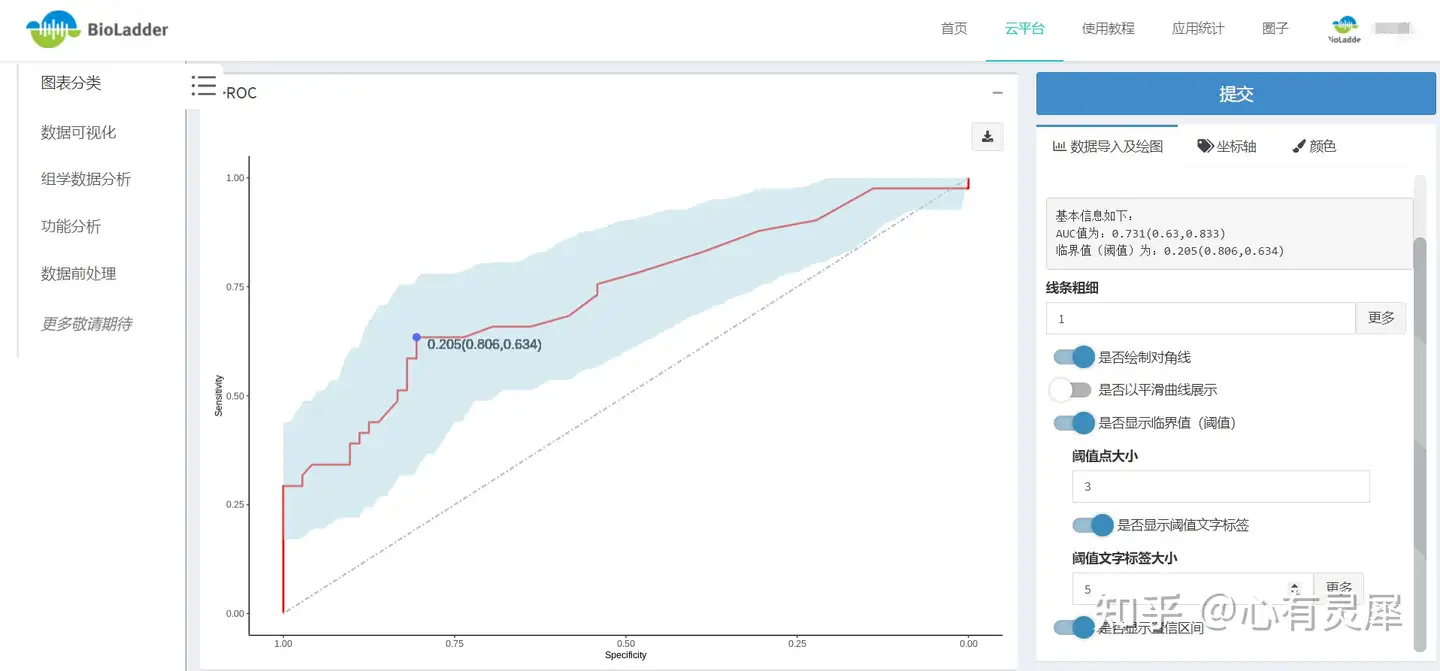
不想写代码?可以用BioLadder生信云平台在线绘制ROC曲线。
网址:https://www.bioladder.cn/web/#/chart/63